Build dashboards on your CRM objects
Build tabbed dashboards under Views with a visual builder — charts, embedded list views, iframes, and rich text on a 12-column grid. Live Views stay AI-generated mini-apps; Dashboards are layouts you design and share from the Dashboards object.
12
Column grid
Place and resize widgets freely
4
Widget types
Chart, view, iframe, rich text
2
Surfaces
Dashboards builder vs Live Views
Build the board once, reuse weekly
Grid layouts under Views → Dashboards — not AI HTML mini-apps.
Teams need recurring reporting surfaces that stay aligned with schema without regenerating HTML every week. Dashboards give you a grid builder over Companies, Deals, and any custom object — open Views → Dashboards, create a record, and edit the layout.
Live Views are still the right path when you want Pilot to invent a one-off table, kanban, or chart from Operations chat. Dashboards are the right path when you want persistent tabs, widget placement, and chart settings you control yourself.
Visual grid builder
Tabs, a 12-column layout, and drag-friendly widgets. Save once; teammates open the same dashboard from Views → Dashboards.
Charts on live CRM data
Bar, line, and gauge charts read current workspace records from a chosen source object — with filters and date granularity.
Distinct from Live Views
Live Views are AI HTML mini-apps from /view. Dashboards are editable page layouts — complementary, not a replacement.
Create
From Views to a shared layout
Dashboards live under Views → Dashboards. Create a record, open Edit, and arrange tabs and widgets on a 12-column grid the team can reopen anytime.
- Open Views → Dashboards
- Add tabs for Pipeline, Activity, or any reporting slice
- Up to 20 tabs and 50 widgets per tab
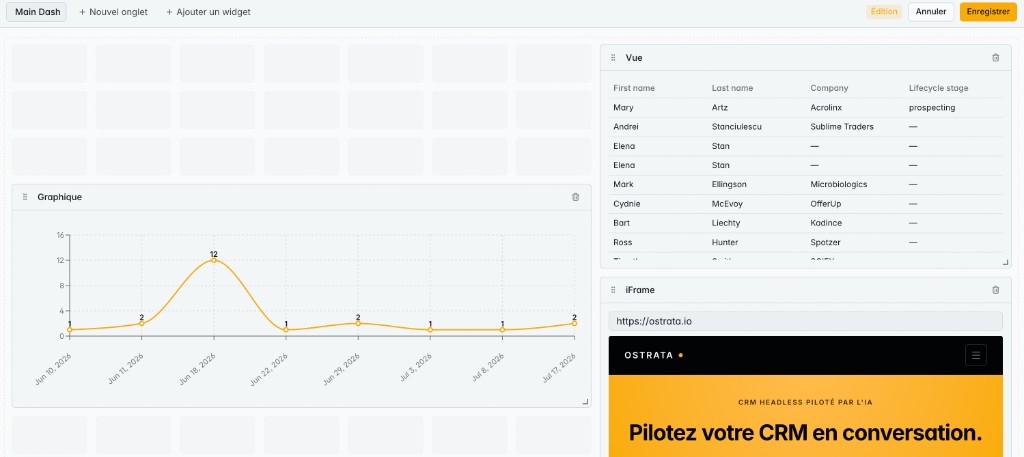
Widgets
Widget types that match the job
Mix charts with embedded Standard views, external pages, and notes on one canvas. Chart settings let you pick the source object, axes, sort, and hide empty buckets.
- Chart widgets with source object, axes, aggregates, and style
- View widgets embed an existing Standard view by ID
- iFrame and rich text for context beside the numbers
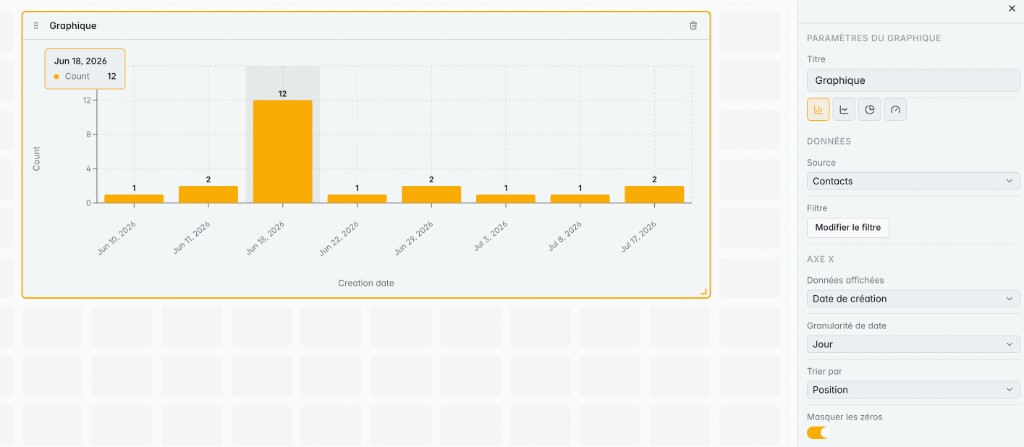
Filters
Filters that keep metrics honest
Each chart can scope records with AND/OR rules, comparisons, and relative dates from the chart settings panel.
- Edit filter from chart settings without leaving the builder
- Relative windows like past 7 days or this quarter
- Save so shared dashboards show the same scoped series
Vs Live Views
When to use Dashboards vs Live Views
Choose the surface that matches how the layout should be authored.
- Dashboards — visual builder, persistent grids, recurring leadership reviews
- Live Views — generate from Operations with /view or natural language
- Both respect workspace schema and permission profiles
Schema
Anchored to your schema
Chart sources are workspace objects and fields — custom types included.
- Pick any readable object as a chart source
- Aggregates: count, sum, avg, min, max, and more
- Layouts refresh from current records when opened
Questions
Short answers before you request access.
- How is a Dashboard different from a Live View?
- Live Views are AI-generated HTML mini-apps created from Operations (/view or plain language). Dashboards are editable grid layouts you build yourself under Views → Dashboards — tabs, widgets, and chart settings you configure and save.
- Where do I create a dashboard?
- Open Views → Dashboards. Create a dashboard record, then use Edit to open the builder, add widgets, and save the page layout.
- What can I put on a dashboard?
- Chart widgets (bar, line, gauge, and related aggregates), embedded Standard views, iframes for external URLs, and rich text blocks. Charts pull from CRM objects in your workspace schema.
- Do dashboard charts update automatically?
- Yes. When you open a dashboard, chart widgets query current workspace records for the configured source object and filters — they are not static exports.